
You’ve got great VR training episodes.
How do you assess trainees rigorously?
How do you simplify gigabits of data?
How do you explain your evaluations in lay terms?
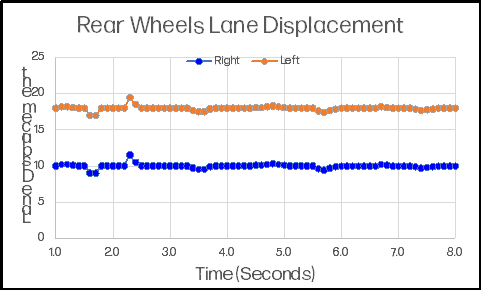
A seasoned trucker navigates a straight segment of highway in a gusty crosswind. The graphic at right shows the displacement of the trailer’s rear wheels over a few moments.
Has a student driver trained on VR picked up the skills to navigate that piece of roadway?
The driver has been trained, but has the driver learned?
We take terabytes of data, extract the information we need to make such judgments, and present those findings in graphical form.
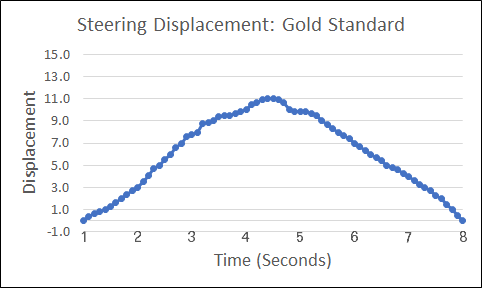
The graphic, “Steering Displacement: Gold Standard,” shows an expert driver going around a corner. The steering wheel moves from 0.0, which is top-dead-center, to the right, back to 0.0 as the turn is completed.
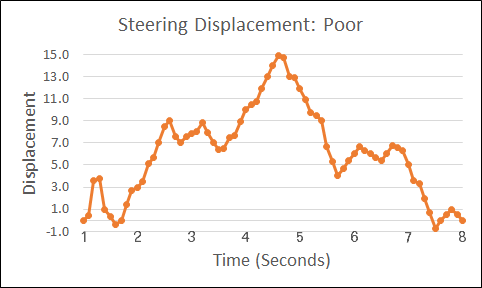
The graphic, “Steering Displacement: Poor,” shows a novice driver negotiating that turn.
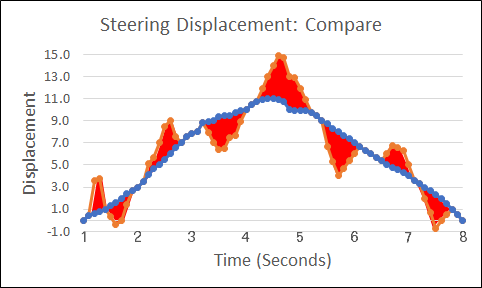
The graphic, “Steering Displacement: Compare,” compares the novice driver’s performance to the “gold standard,” with the difference highlighted in red. End users can interpret the graphic without concerning themselves with the underlying calculations: The less red is seen, the more competence the driver is demonstrating.
A comprehensive analysis may require dozens of fields—steering, but also accelerating, braking, looking, and more—and as many as 100,000 records for a brief episode. But the complexity is transparent to the person reviewing the analysis.
Explore VR Testing
Contact us about certification testing using virtual reality
The simplicity of the graphics belies the sophistication of analysis they can convey. Our graphs visually characterize results, but the calculations underlying them also depict the certainty with which performance predictions can be made. Our buffering strategy minimizes write overhead, while assuring that nothing significant is missed or obscured.
Characteristics
Alerts
Even with all the fields defined for normal observation, unexpected events will happen. In our trucking episode, these might be an oblivious jaywalker, a railroad crossing, or some other phenomenon. We have unassigned data columns for such Alerts—events that have a beginning and an end and that require unique processing. As many as four events can be processed simultaneously, concurrent with regular observations.
Security
Our playlist randomization process allows randomized scenarios to be assembled prior to administration. This generates large numbers of potential scenarios while eliminating transition pauses which would occur if we generated random events on the fly.
Design
We are partners in the design phase, making sure that scenarios have only the redundancy necessary to achieve high reliability. We identify unnecessary actions that contribute little to the analytical power of a scene.
Data
We work with you to minimize the fields necessary to evaluate critical skills, while assuring that logs contain all the data necessary for post-processing.
Calibration
The VR experience must be calibrated to allow comparison of trainees’ performance with that of competent practitioners. We help define the conditions of calibration, select informants, and evaluate the predictive power of performance targets.
Partners
We are looking for development partners who have training episodes that would benefit from stringent psychometric planning, implementation, and analysis. We do not do VR development; we strategize VR evaluation and we conduct the calculations necessary to decompose and display the results.
Our goal
is to conduct psychometrically valid analysis that presents clear, accurate, and intuitive results to our clients and to their trainees.